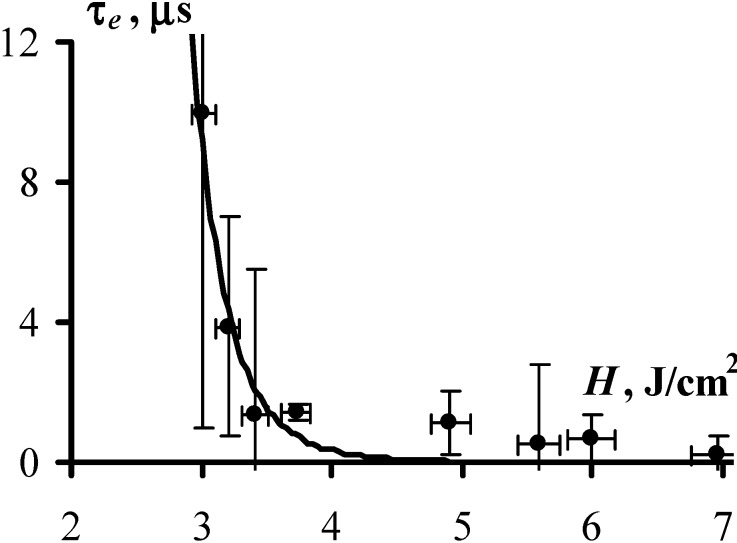
Figure 4.
The duration of the induction period as a function of initiation exposure (1,064 nm, 10 ns) is demonstrated with the experimentally measured average time prior to explosion with at least ten PETN samples exploded at each H (dots) and with approximation by Equation (4) with C = 3.5 J/cm2, k = 35, and τ0 = 1.7 ± 0.3 µs (solid line). The parameters C and k are obtained from Figure 3. The values of τ0 were calculated from the slop of the τe~f(1/W-1). The large error of the first point on the graph (at H = 3 J/cm2) results from a small number of successful measurements as only two samples exploded out of ten. Good correspondence between calculated and experimental data is observed despite the large uncertainty of the individual measurements.

