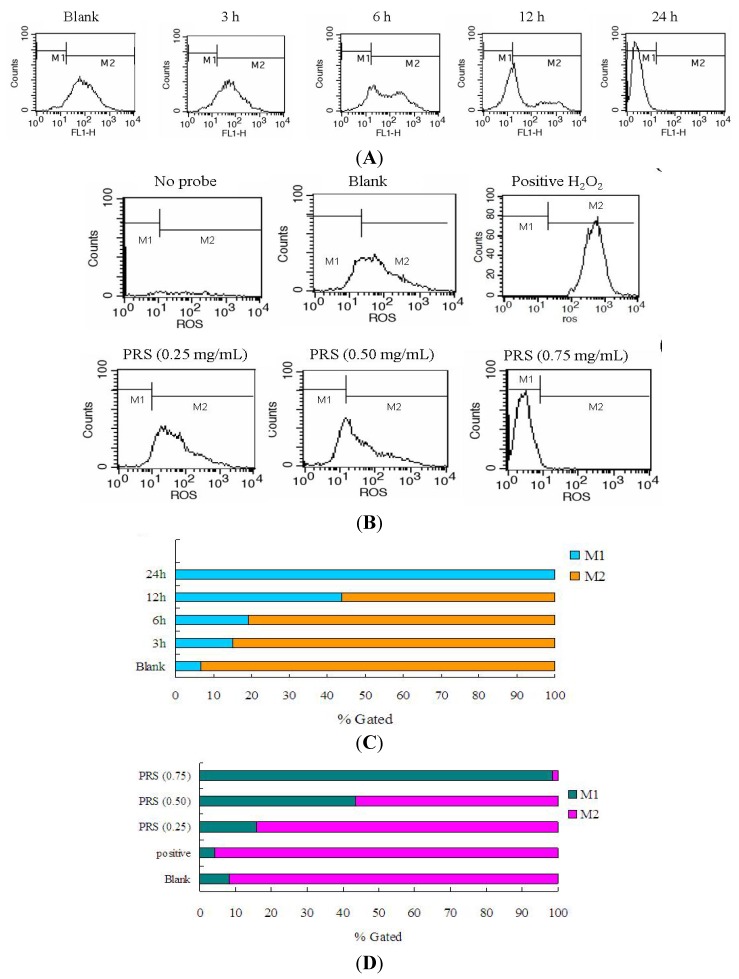
Figure 8.
Reduction of PRS on ROS generation in A549 cells. Cells were induced in absence or presence of PRS (0.5 mg/mL) for 3, 6, 12 or 24 h (A and C) and then ROS production was assessed by flow cytometry with a fluorescence probe 2',7'-dichlorodihydrofluorescein diacetate (DCFH-DA) staining. Furthermore, A549 cells were treated with PRS (0.25, 0.5, 0.75 mg/mL) for 24 h (B and D). In this study, 100 μM H2O2 was chosen as a positive control. The significant increase in ROS was calculated the counts in the M2 region.

