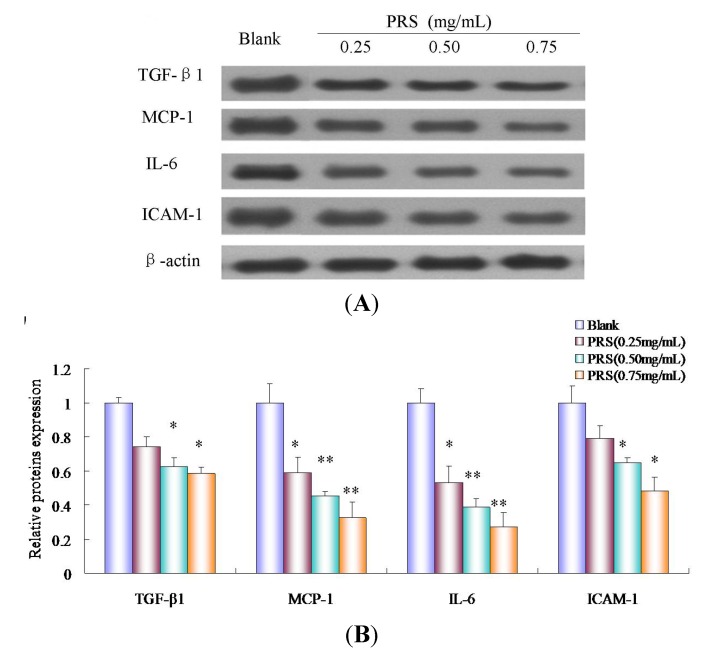
Figure 9.
Effect of PRS on the expressions of inflammation-related proteins by Western blotting. A549 cells were incubated in the presence and absence of PRS (0.25, 0.50 and 0.75 mg/mL) for 24 h. Cells were homogenized, lysed, 50 μg of protein samples were submitted to 10% SDS-PAGE and electroblotted. Enhanced chemiluminescence system was used for visualization (A) and protein expression was quantified by IPP software. Results are expressed as the ratio of the band volume of PRS to that of blank. The data are expressed as means ± SD (n = 6). * p < 0.05; ** p < 0.01, vs. blank.

