Figure 3.
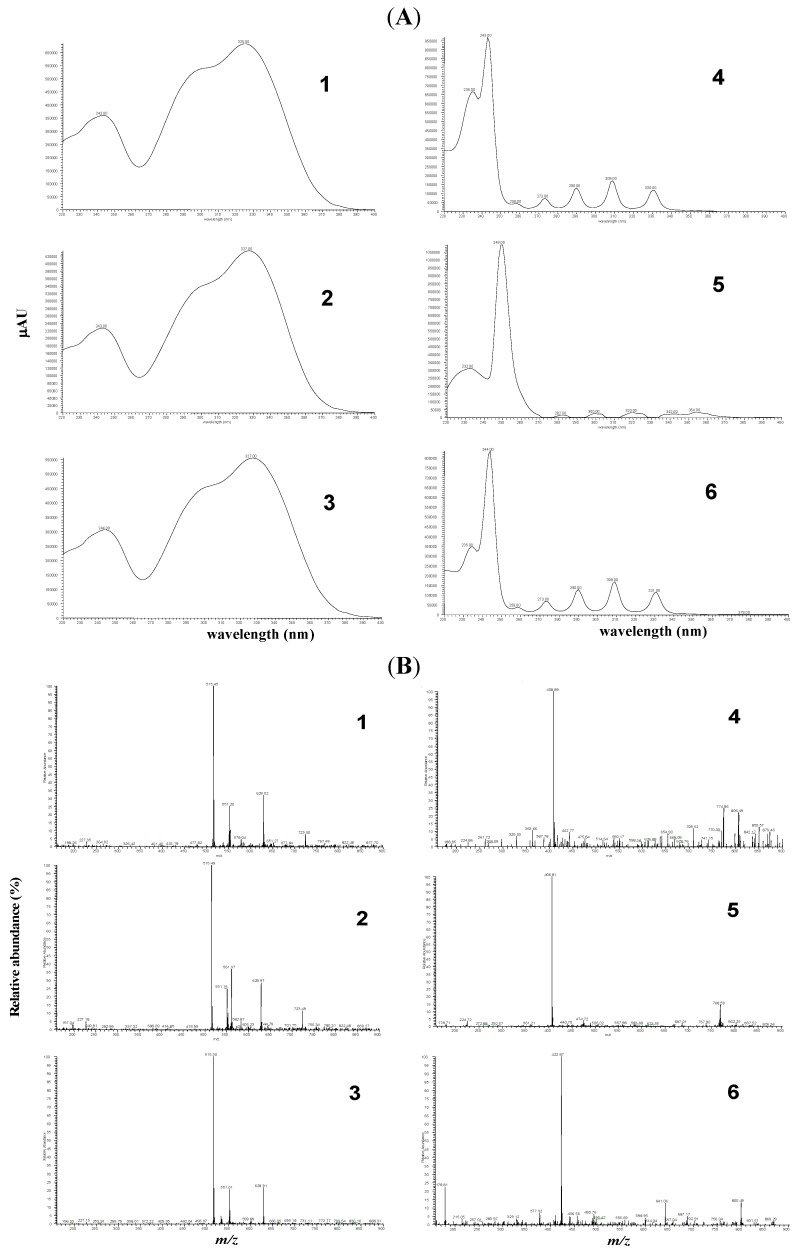
(A) UV Spectra (220–400 nm) of three caffeoylquinic acid derivatives (DiCQAs 1, 2 and 3) and three polyacetylenic glucosides (PGAs 4, 5 and 6) showing peaks with similar UV spectra, respectively; (B) The mass spectra obtained from a HPLC coupled to negative electrospray ionization (LC-ESI-MS) (DiCQAs 1, 2 and 3) and negative atmospheric pressure chemical ionization mass spectrometry (LC-APCI-MS) (PGAs 4, 5 and 6) based on m/z of molecular and product ions.

