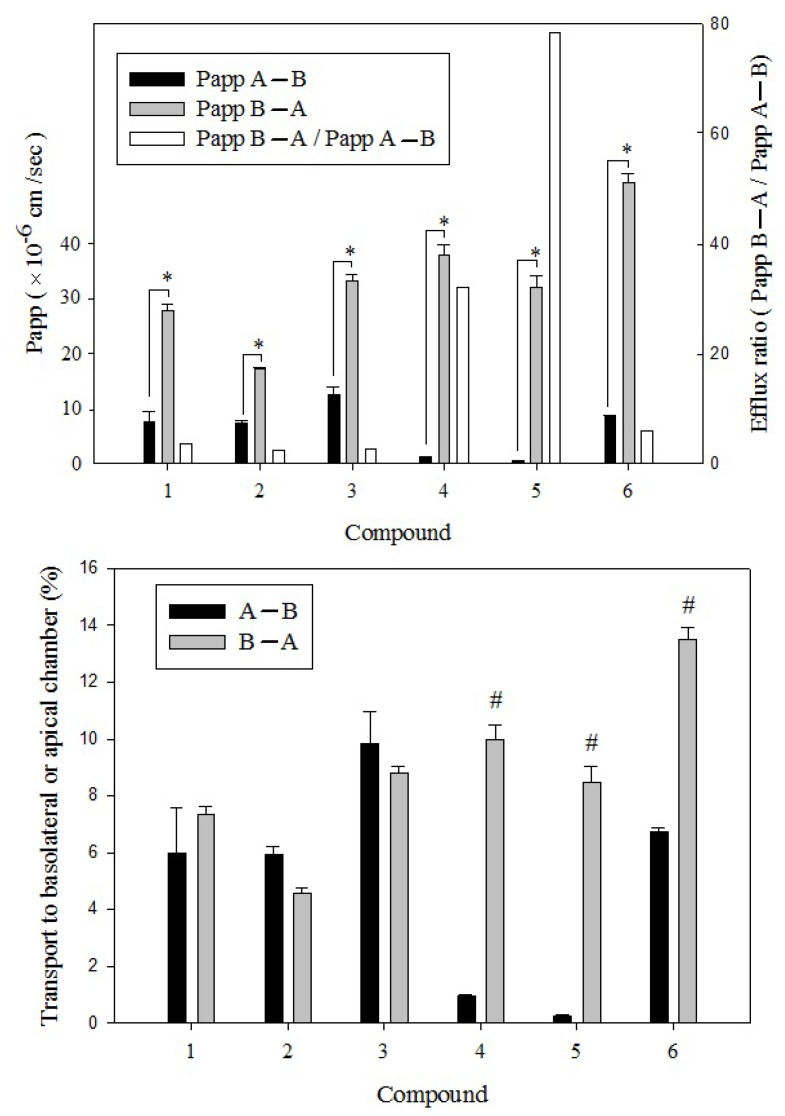
Figure 6.
The apparent permeability coefficient (Papp) (upper panel) and the transport percentage (lower panel) of each compound in EM of BPR in the secretory (B–A) direction (□) and in the absorptive (A–B) direction (⬛), and the efflux ratio (□). The structures and names of compounds 1–6 are referred to Figure 2. * Papp value of each tested compound in the secretory (B–A) direction significantly greater compared with Papp value in the absorptive (A–B) direction (p < 0.05). # Transport of each compound in EM of BPR in the secretory (B–A) direction significantly greater compared with in the absorptive (A–B) direction (p < 0.05).

