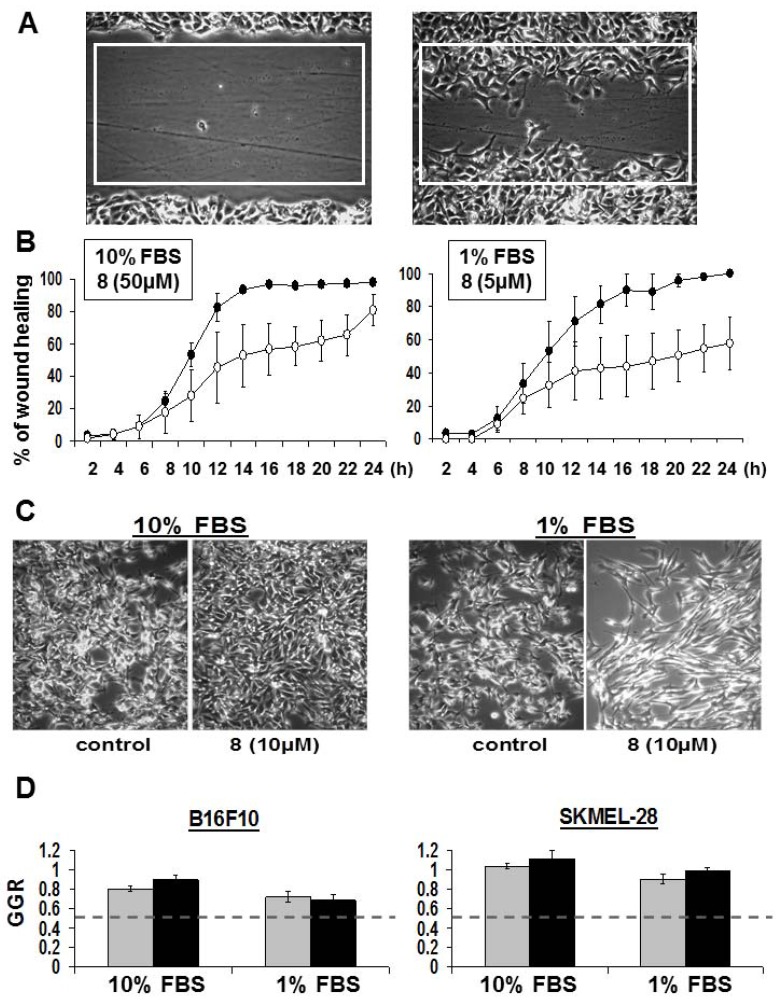
Figure 5.
Anti-migratory effects of DBHB (8) on cancer cells. (A) Image of a wound made in confluent B16F10 cells at t = 0 h and 6 h after. Quantification of the area of the white rectangle healed over time is shown in (B) for cells cultured in 10 vs. 1% FBS. Black dots: control; open dots: DBHB treated condition at 50 µM or 5 µM as indicated. (C) Images of B16F10 cells left untreated or treated for 48 h with DBHB at 10 µM. (D) Quantitative data of B16F10 and SKMEl-28 cell growth ratio (control condition GGR = 1) when treated with 10 µM of DBHB for 24 h (gray bars) and 48 h (black bars). All data are expressed as the mean ± SEM.

