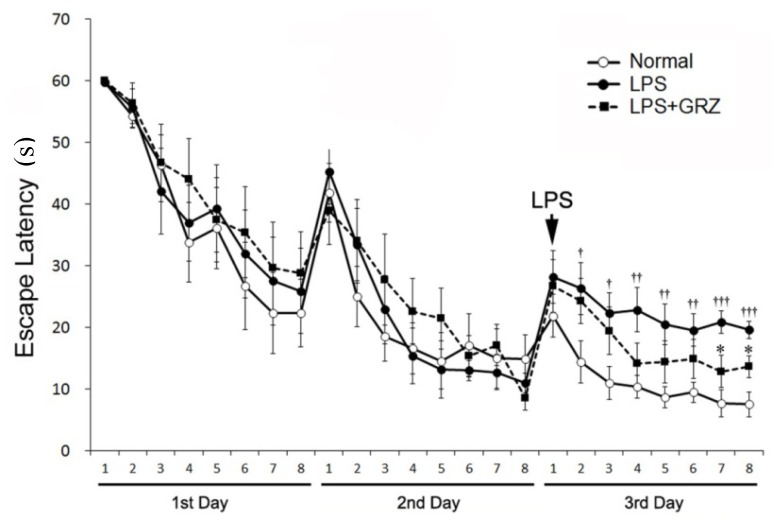
Figure 5.
Effect of GRZ on the acquisition training trials. The escape latencies on the 1st and 2nd day were not different among the normal, LPS, and LPS+GRZ groups (F2,21 = 0.33, p = 0.723; F2,21 = 0.13, p = 0.882; respectively). The LPS + GRZ group showed significantly shorter escape latency at the 7th and 8th trials on the 3rd day, while the escape latency for the total trials on the 3rd day was significantly different from the LPS group (F1,14 = 1.98, p = 0.181). Data are represented by mean ± SEM (n = 12 in each group; † p < 0.05; †† p < 0.01; ††† p < 0.001 compared to the normal group; * p < 0.05 compared to the LPS group).

