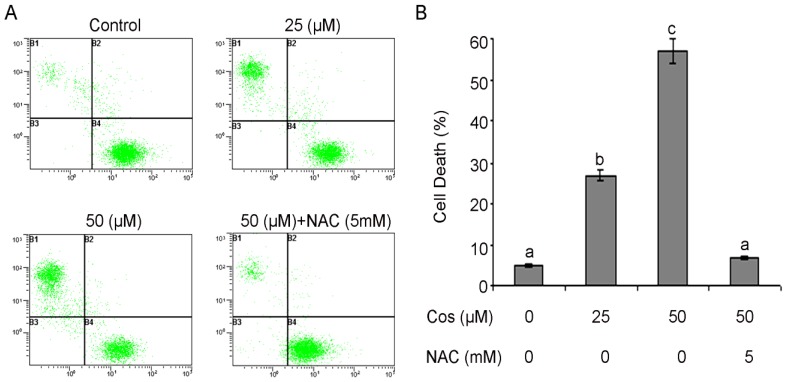
Figure 4.
Determination of cell viability by calcein/PI staining and flow cytometry. (A) T24 cells were treated with 25 and 50 µM of costunolide in the presence or absence of NAC for 24 h. Histograms show number of PI positive cells (y-axis) vs. calcein positive cells (x-axis). The data shown are representative of three independent experiments with the similar results. (B) Data are expressed as Mean ± SD (n = 3). Columns not sharing the same superscript letter differ significantly (p < 0.05).

