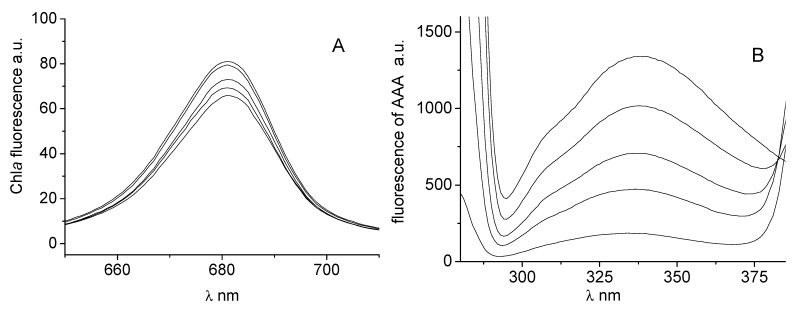
Figure 3.
Emission fluorescence spectra of chlorophyll a in suspension of spinach chloroplasts without and with compound 1 (c = 0, 0.059, 0.117, 0.234 and 0.468 mmol/L; curves from top to bottom) (A), and emission fluorescence spectra of aromatic amino acids in suspension of spinach chloroplasts without and with 1 (c = 0, 0.012, 0.029, 0.059, 0.117 mmol/L) (B).

