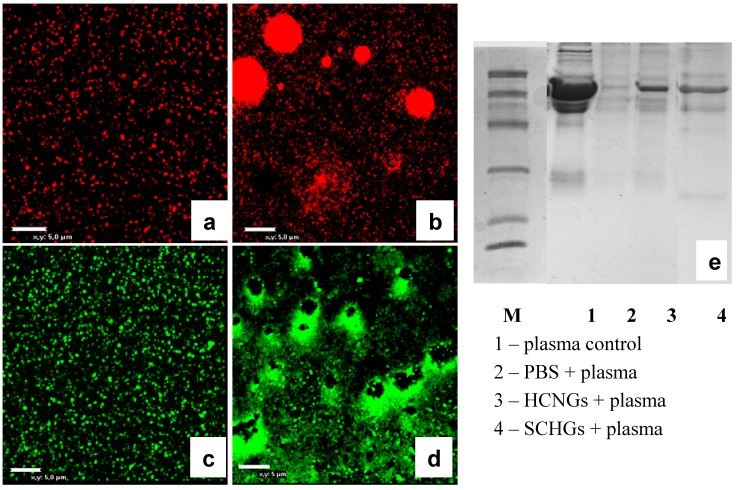
Figure 6.
Confocal images of fluorescent HCNGs (a,b) and SCNGs (c,d) before (a,c) and after incubation for 30 min with diluted blood plasma. (e) Gel-electrophoresis of blood plasma loaded onto NGs (line 1); collected in the sediment after centrifugation (line 2); or eluted from NGs (lines 3–4) shows differences in protein spectra. Bar corresponds to 5 um.

