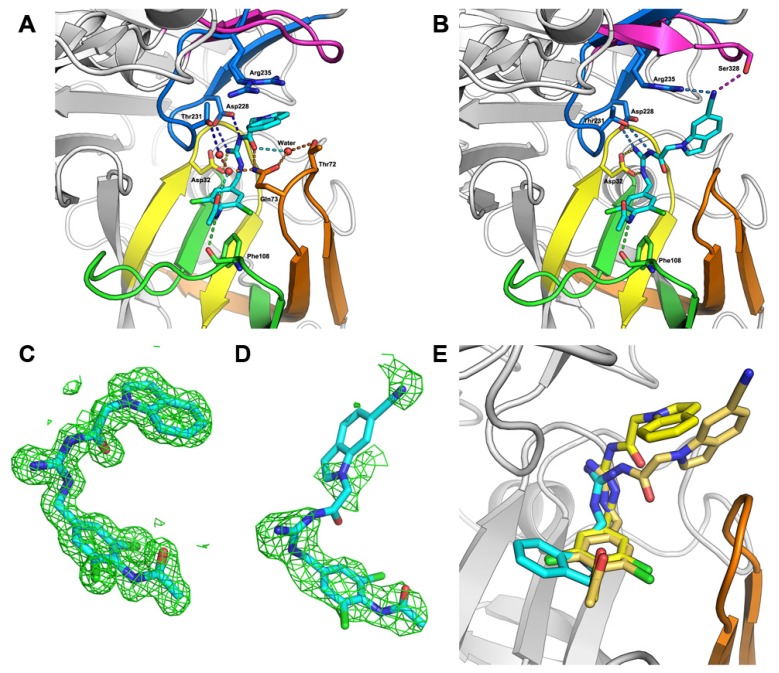
Figure 3.
The structures of BACE1 in complex with compounds. (A–B) Cartoon representation of the crystal structure of BACE1 in complex with compounds 19 (A) and 25 (B). The pdb codes for generating figures A and B are 4IVT and 4IVS, respectively. The key residues and ligands 19 and 25 are highlighted with sticks. (C–D) (Fo− Fc) difference electron-density maps contoured at 2.0 σ for compounds 19 (C) and 25 (D). (E) The superimposition of the structures of BACE1 in complex with the compounds 19, 25 and the docked fragment. Three small molecules were shown with sticks.

