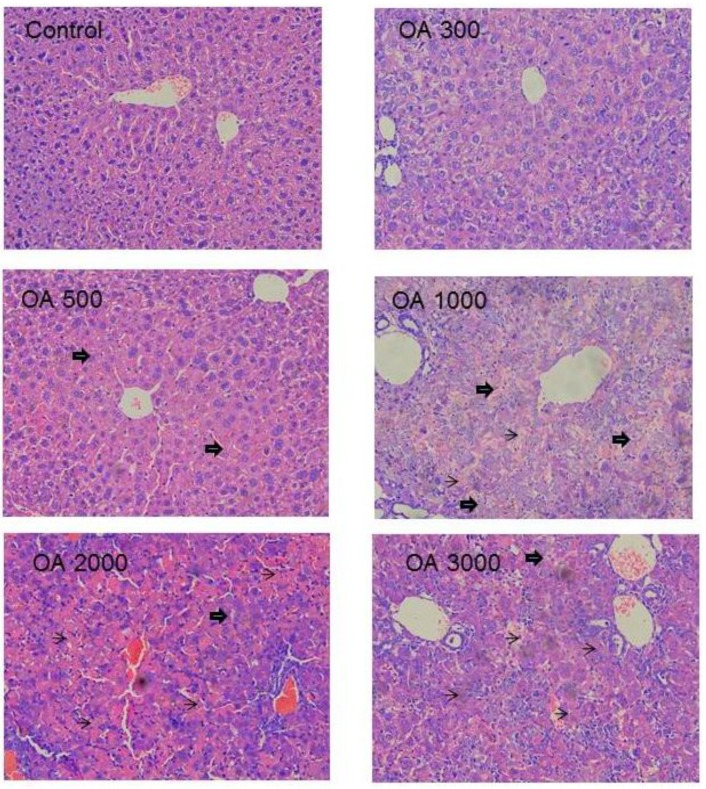
Figure 3.
Representative liver histopathology. Mice were gavaged OA at doses of 100–3,000 µmol/kg (equal to 45–1,350 mg/kg) for 10 days. At the end of experiment, livers were fixed in neutral formalin and subjected to standard histology procures. Slides were stained H&E. big-arrows indicate feathery degeneration indicative of cholestasis and thin-arrows indicate hepatocellular cell death. Magnitude (×200).

