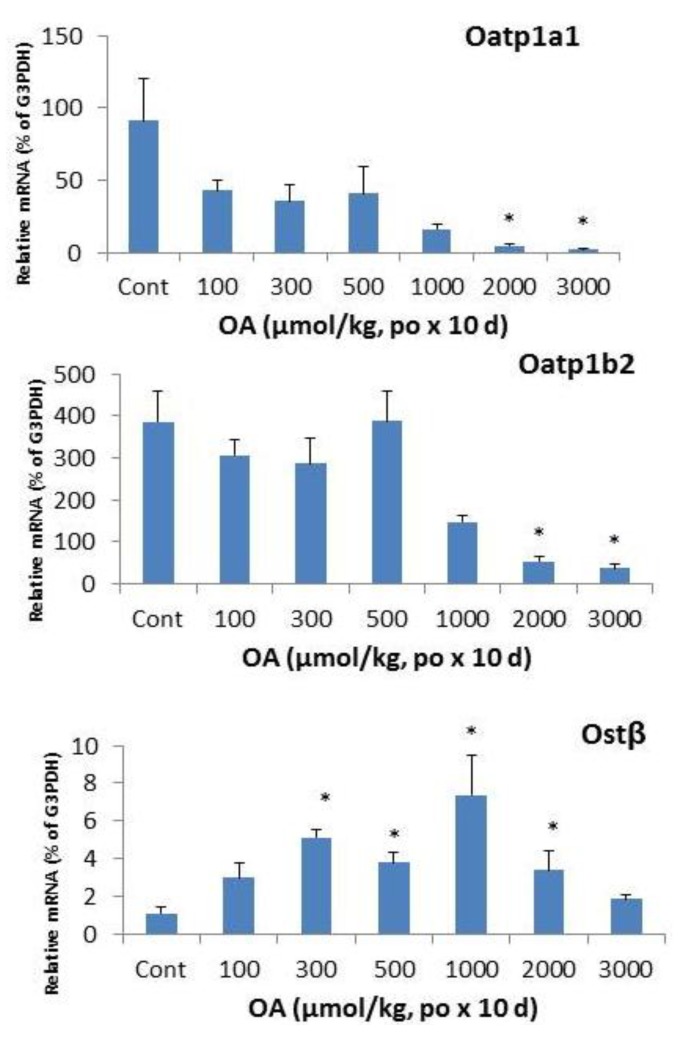
Figure 6.
Expression of hepatic transporters. Mice were gavaged OA at doses of 100–3,000 µmol/kg (equal to 45–1,350 mg/kg). Twenty-four hours after the last dose, Livers were collected to isolate total RNA. The expression of hepatic transport Oatp1a1, Oatp1b2, and Ostβ were determined by real-time RT-PCR as detailed in the Methods. Data are mean ± SEM (n = 5–8). *Significantly different from control, p < 0.05.

