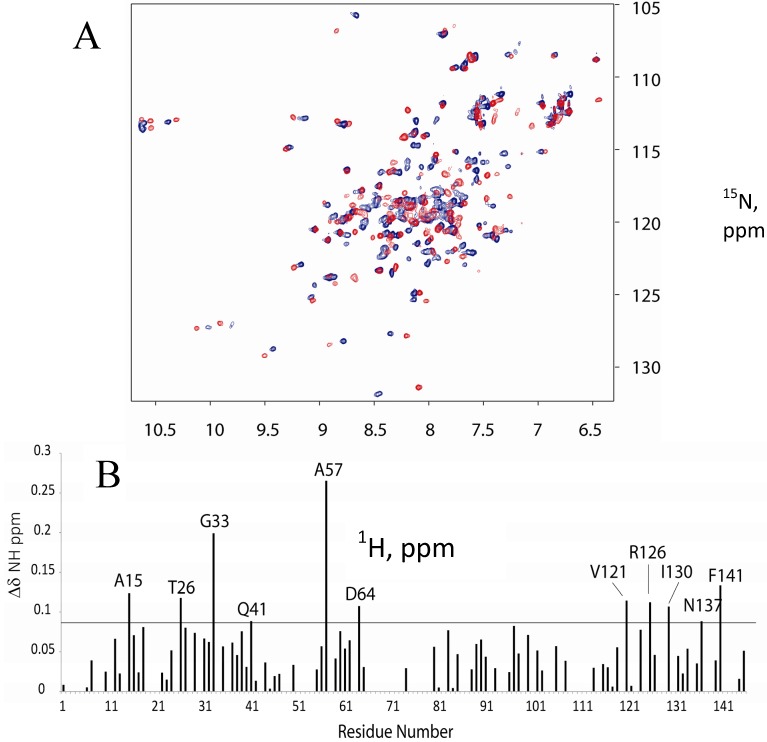
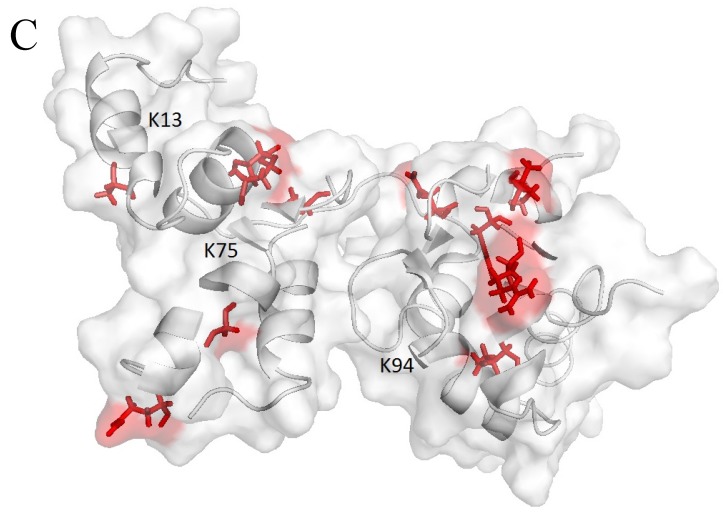
Figure 1.
(A) Overlay of CaM spectrum without (red) and with (blue) the FM-HVR peptide. The final concentrations of CaM and FM-HVR were 25 μM and 50 μM, respectively. (B) Residual chemical shifts obtained after the NMR titration of CaM with FM-HVR peptide. The horizontal line in the graph shows the sum of average chemical shift perturbation and standard deviation. Residues that show zero chemical shift difference on the graph were the ones that were not assigned due to resonance overlap. (C) Statistically significant chemical shift differences were mapped on the structure of CaM (PDB: 1CFF). K13, K75 and K94 have been labeled. We make the use of these residues in reductive methylation to investigate CaM FM-HVR interactions.


