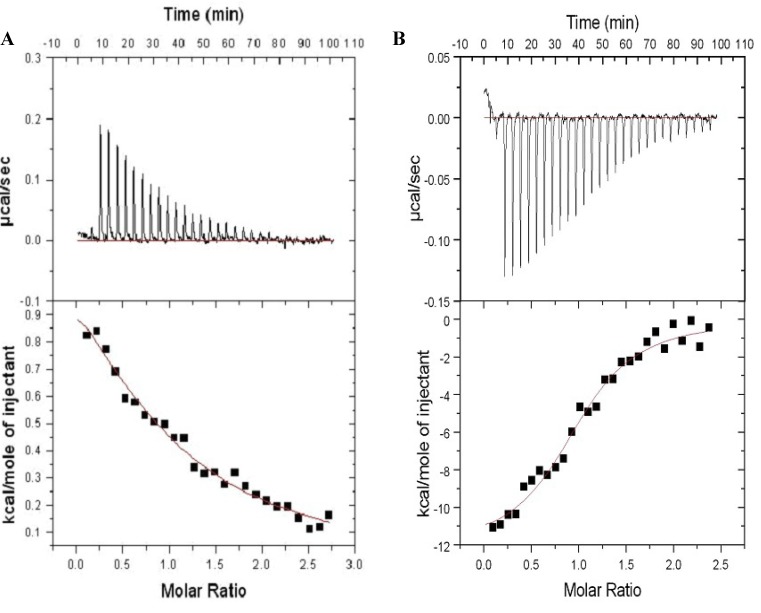
Figure 3.
Isothermal Titration Calorimetry of (A) 70 μM HVR peptide with 1 mM CaM, and (B) 2.9 μM FM-HVR peptide with 33 μM CaM. The upper panels in (A) and (B) show titration isotherms. The lower panels in (A) and (B) show the fit of the reference-subtracted titration. The “one set of binding sites” model were used in (A) and (B).

