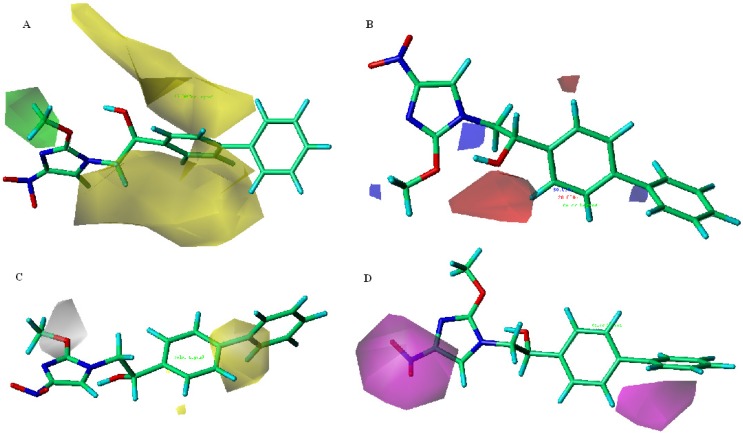
Figure 5.
Contour plots with the combination of compound 15 for CoMSIA model IC; (A) Steric contour map. Green polyhedrons indicate regions where bulky groups increase activity; Yellow polyhedrons indicate regions where bulky groups decrease activity; (B) Electrostatic contour map. Red polyhedrons indicate regions where negative charges increase activity; Blue polyhedrons indicate regions where positive charges increase activity; (C) Hydrophobic contour map. Yellow polyhedrons indicate regions where hydrophobic substituent enhances activity; Gray polyhedrons indicate regions where hydrophobic groups decrease activity; (D) H-bond acceptor contour map. Magenta polyhedrons indicate regions where H-bond acceptor substituent increases activity.

