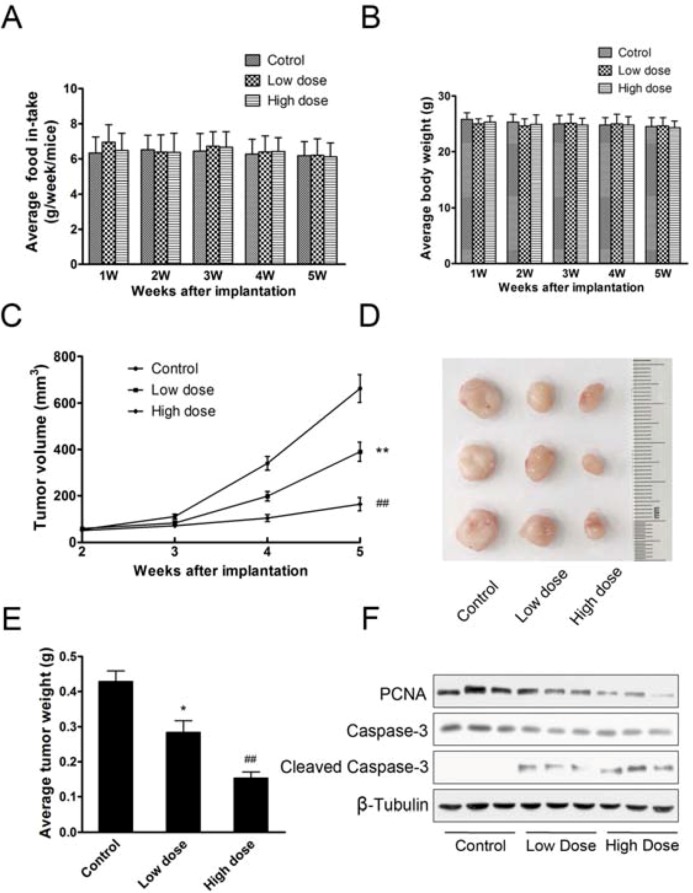
Figure 4.
Aconitine suppressed in vivo tumor growth. (A) Average body weight of mice; (B) Average food in-take of mice every week; (C) Growth curve of tumors treated with different doses of aconitine; (D) Representative picture of tumors; (E) Average weight of tumors; (F) Western blotting analysis of protein expression of PCNA, Caspase-3 and Cleaved Caspase-3 in representative tumors. Data were means ± SEM. * p < 0.05, ** p < 0.01 represented that group of low dose of aconitine compared to control (0 µg/mL of aconitine), while ## p < 0.001 represented that group of high dose of aconitine compared to control.

