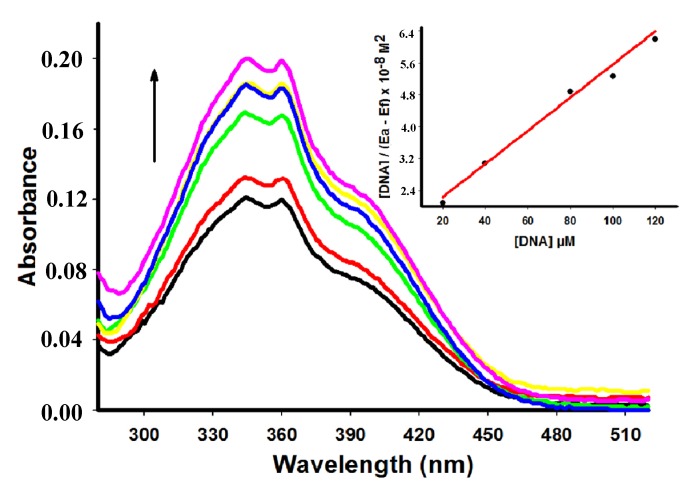
Figure 3.
Absorption spectra of derivative 5 (50 µM) with increasing concentrations of ctDNA. [DNA] = 0 (black), 10 (red), 20 (green), 40 (yellow), 60 (blue), 80 (pink) µM. Arrow (↑) refers to hyperchromic effect. Inset: corresponding to the plot of [DNA]/(εa − εf) as function of DNA concentration as determined from the absorption spectral data.

