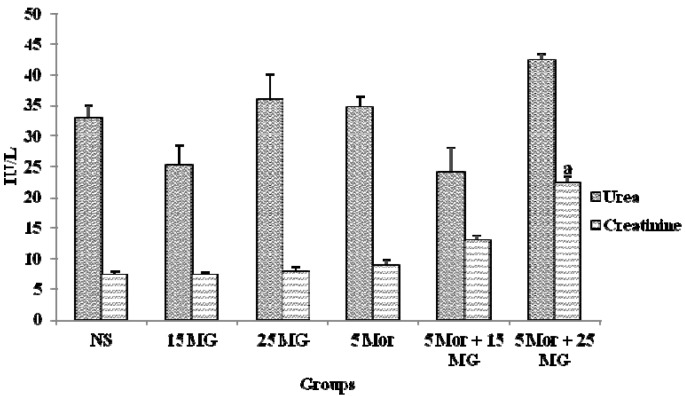
Figure 6.
The levels of urea and creatinine in control group (normal saline), mitragynine (15 mg/kg, 25 mg/kg), morphine (5 mg/kg) and combination groups (5 mg/kg Mor + 15 mg/kg; 5 mg/kg Mor + 25 mg/kg). Each column represents the mean ± SEM of IU/L of seven animals in each group (n = 7). Values are statistically siginficant at p < 0.05. a: Combination treatment group compared with control group.

