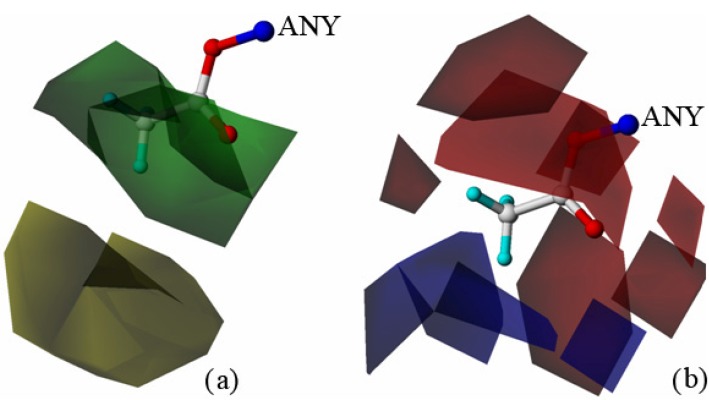
Figure 5.
Contour maps of topomer CoMFA around R2. (a) Steric contour map depicted around R2 (green favored; yellow disfavored); (b) electrostatic contour maps depicted around R2. Blue contours indicate the regions where electropositive groups increase activity, and red contours indicate the regions where electronegative groups increase activity.

