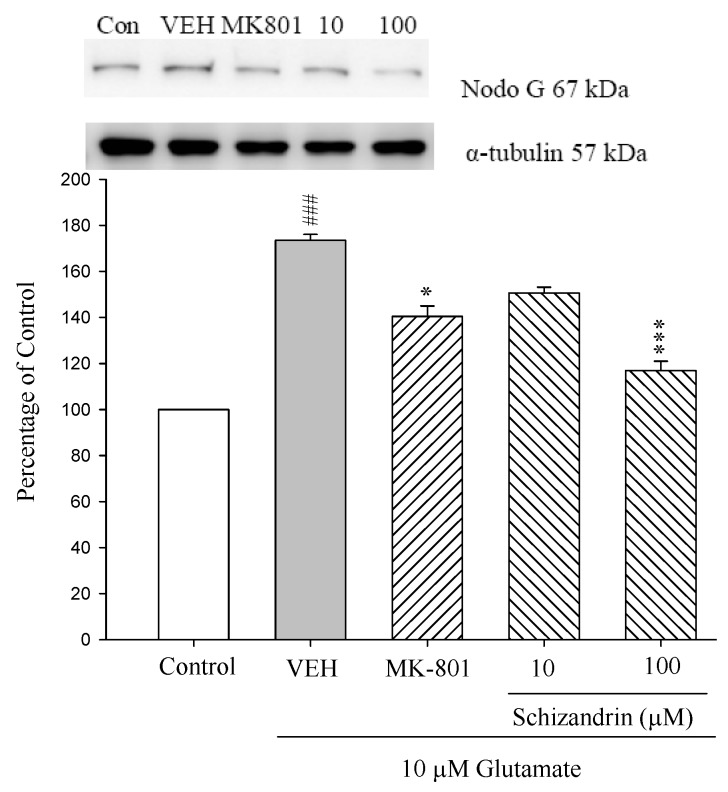
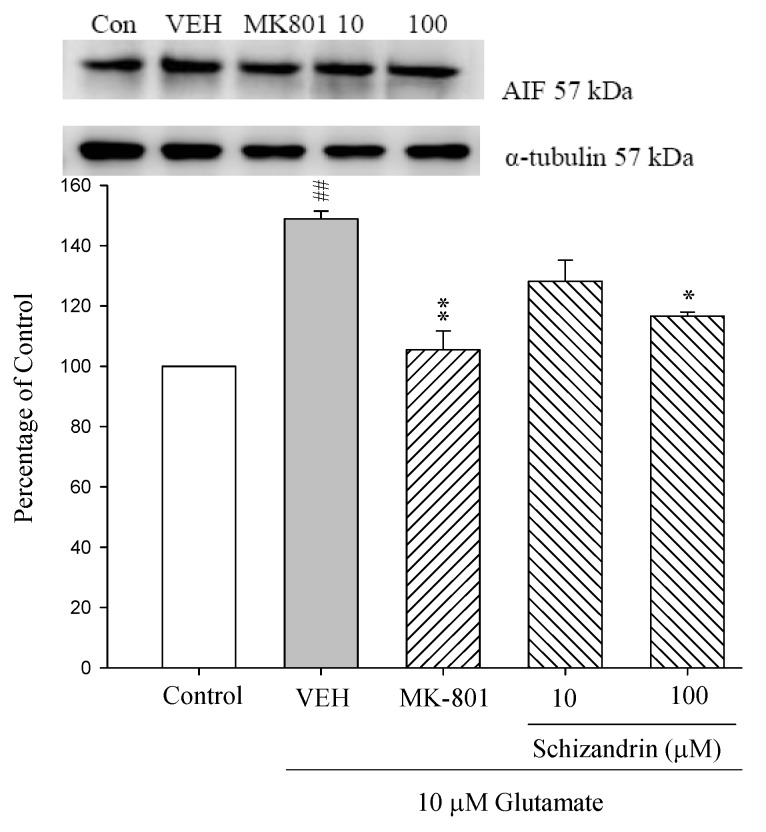
Figure 3.
Comparison of western blot analysis of schizandrin on glutamate-induced protein expression level change of AIF, Nod G and α-tubulin in rat cortical cells. Cortical cells were pretreated with schizandrin (10 and 100 μM) or MK-801 (15 μM) 2 h before exposure to 10 μM glutamate and then maintained for 24 h. ## p < 0.01 as compared with control group. * p < 0.05, ** p < 0.01 as compared with VEH group (N = 3). α-Tubulin was used as an internal loading control.


