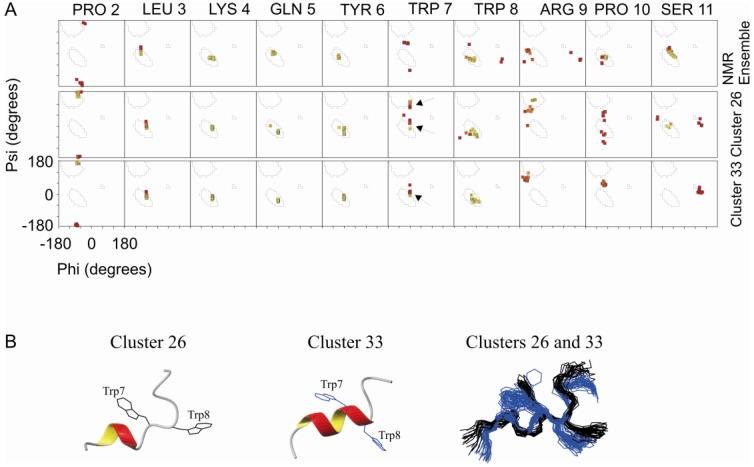
Figure 3.
Ramanchadran plot of NMR ensemble, cluster 26 and cluster 33. (A) The Ramachandran plot is shown for each amino acid residue of PW2 in the NMR ensemble (top), cluster 26 (middle) and cluster 33 (bottom). The 310-helix spans from Leu 3 to Tyr 6 for NMR ensemble, while in cluster 26 and cluster 33, from Leu 3 to Trp 8. (B) Ribbon representation of clusters 26 (left) showing the side chains in black and cluster 33 (middle) in dark blue. In the right, superposition of clusters 26 and 33 showing the same spatial orientation of residues Trp 7 and Trp 8. The arrows indicate the two allowed region of Trp 7 observed for the two clusters.

