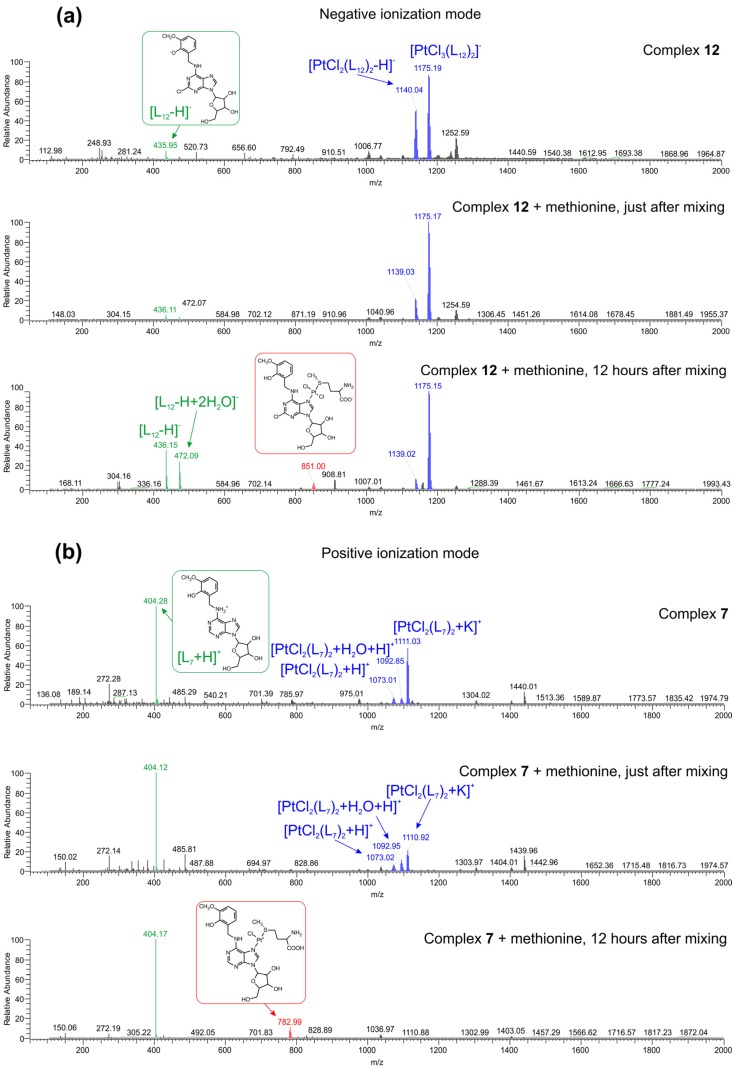
Figure 2.
(a) The ESI− mass spectra of 12 (top spectrum), and interacting systems with l-Methionine measured immediately after the preparation (middle spectrum) and 12 h after the preparation (lower spectrum); (b) the ESI+ mass spectra of 7 (top spectrum), and interacting systems with l-Methionine measured immediately after the preparation (middle spectrum) and 12 h after the preparation (lower spectrum).

