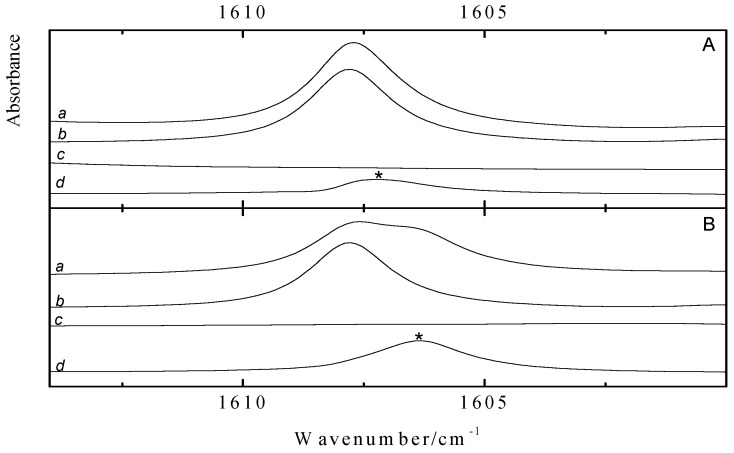
Figure 5.
Infrared spectra of the in plane deformation ν4 (A1) of toluenefor LKr solutions of mixtures of CF3Br (panel A) or CF3I (panel B) with toluene at 120K. Additional bands are visible in the spectrum of the complex (trace d), which is obtained after subtracting the rescaled monomer traces b and c from the mixture trace a. Traces b and c show the solution containing only toluene and CF3X (with X = Br, I), respectively. New bands appearing in thespectrum of the complex are marked with an asterisk (*) and are assigned to the 1:1 complex.

