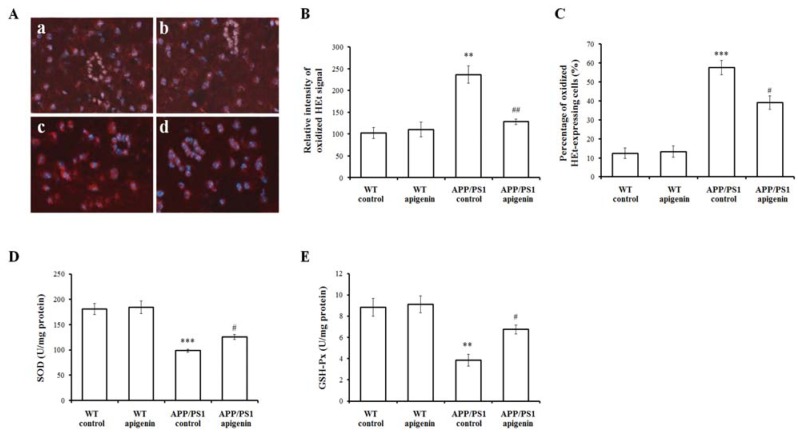
Figure 4.
Apigenin treatment inhibits oxidative stress in APP/PS1 mice. (A) Representative images of oxidized HEt staining in cortex of WT mice and APP/PS1 mice (200 ×). a, WT vehicle control; b, apigenin-treated WT; c, APP/PS1 vehicle control; d, apigenin-treated APP/PS1. (B,C) Quantitative analysis of the relative cytosolic oxidized HEt intensity and the percentage of oxidized ethidium-expressing cells. Data are presented as mean ± S.E.M., n = 3. ** p < 0.01, *** p < 0.001 vs. WT control, # p < 0.05, ## p < 0.01 vs. APP/PS1 vehicle control. (D,E) The activities of oxidative stress markers, SOD (D) and GSH-Px (E), in extracts of cerebral homogenates in APP/PS1 mice. Data are presented as mean ± S.E.M., n = 4. ** p < 0.01, *** p < 0.001 vs. WT vehicle control mice, # p < 0.05 vs. APP/PS1 vehicle control mice.

