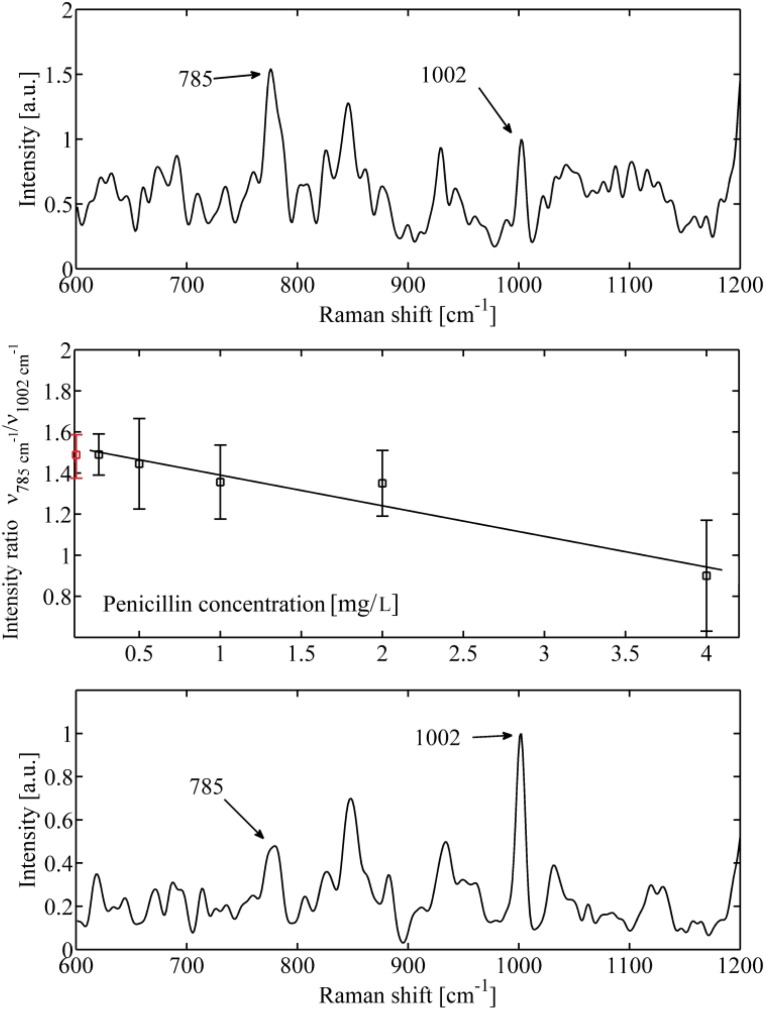
Figure 3.
An example of Staphylococcus epidermidis response to bactericidal action of penicillin. (a) Top—Raman spectrum obtained for low antibiotic concentration (0.2 mg/L). The DNA peak at 785 cm−1 is clearly visible together with phenylalanine peak at 1,002 cm−1. (b) Middle—mean value of ratio of maximum of Raman intensity at 785 cm−1 versus 1,002 cm−1 for different concentrations of applied penicillin measured from 10 different cells. Mean value of a control sample not exposed to antibiotic (red circle) is shown. (c) Bottom—Raman spectrum obtained for higher antibiotic concentration (4 mg/L). The DNA peak at 785 cm−1 nearly disappeared which, again, indicates damage of DNA.

