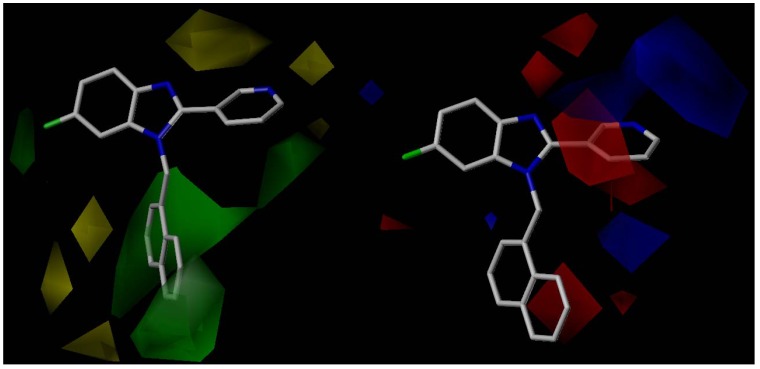
Figure 8.
Left: CoMFA steric contour map for the most active compound 39. The green contour indicates where a bulky group favors activity, while the yellow contour indicates where a small group favors activity. Right: CoMFA electrostatic contour map for the most active compound 39. The blue contour indicates where positive charge favors activity, while a red contour indicates where negative charge favors activity.

