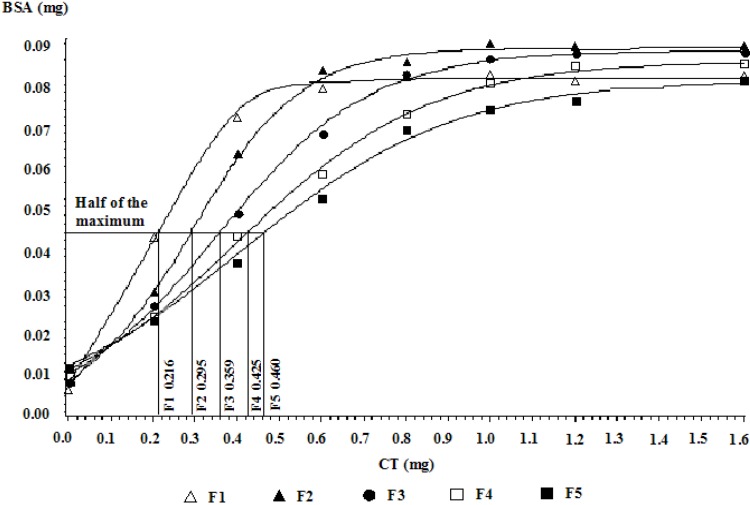
Figure 5.
Protein-binding affinities of CT fractions of different molecular weights from LLR. The Y-axis represents the bonded bovine serum albumin (BSA) values, and the X‑axis represents different CT amounts. The standard deviations (SD) for all the CT fractions in the protein binding assay were below 0.002.

