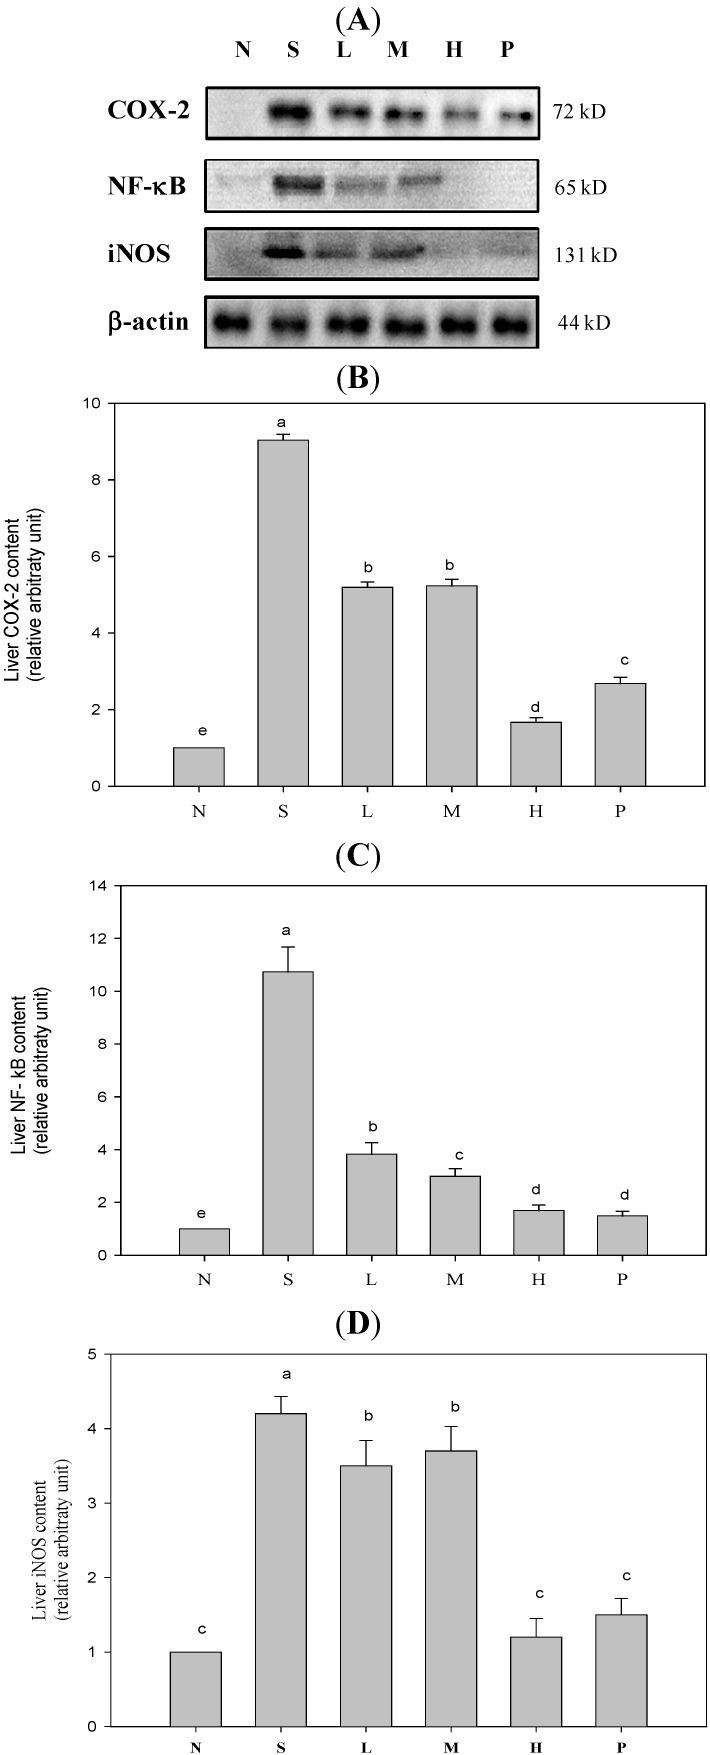
Figure 1.
COX-2, NF-κB, and iNOS inflammatory protein expression of LPS-induced sepsis mice. (A) The western blotting results of COX-2, NF-κB, and iNOS. (B) The immunoblot quantitative result of COX-2 protein. (C) The immunoblot quantitative result of NF-κB protein. (D) The immunoblot quantitative result of iNOS protein. Values are the mean ± SD of each group. Values not sharing a superscript (a–e) differ significantly by one-way ANOVA and Duncan’s Multiple Range Test (p < 0.05) among groups. One representative immunoblot from three independent experiments is shown. N: Normal group, S: Sepsis group (i.p. LPS), L: Sepsis group with low-dose WBG, M: Sepsis group with moderate-dose WBG, H: Sepsis group with high-dose WBG, P: Positive control group (i.p. PDTC).

