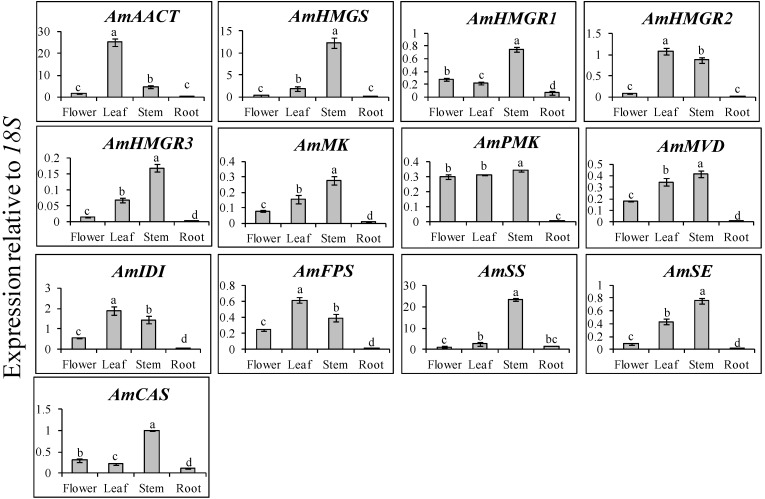
Figure 1.
Transcript levels of triterpenoid biosynthetic genes in the flower, leaf, stem, and root of Huangqi. The height of each bar and the error bars show the mean and standard error, respectively, based on 3 independent measurements. Mean values indicated by the same letter are not significantly different at p ≤ 0.05, using Duncan Multiple Range Test (n = 3).

