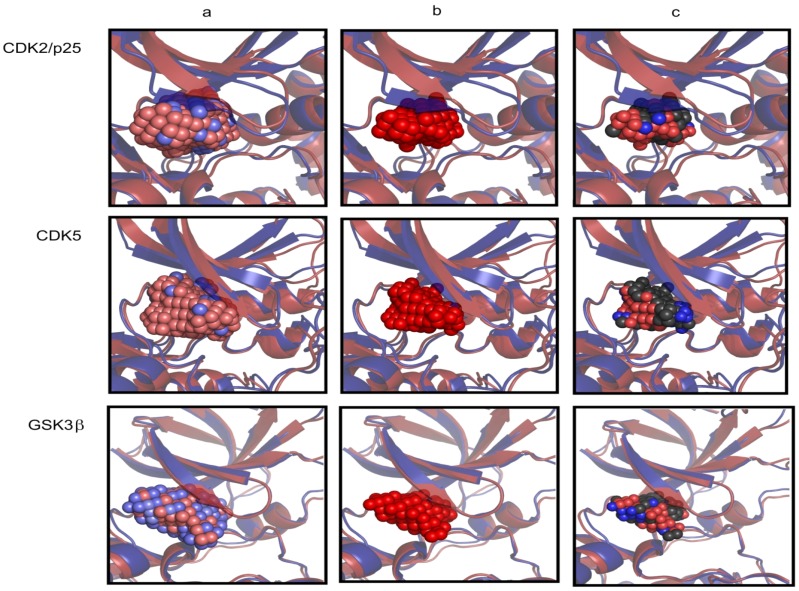
Figure 8.
The results of the ASP MD simulation illustrated for CDK5/p25, CDK5 and GSK3β. Graphic showing the starting protein conformation prior to ASP (blue cartoon model) and the conformation after the insertion of 150 ASP particles (red cartoon model). (a) The latent ASP particles coloured from high force (blue spheres) to low force (red spheres); (b) The kinase protein conformations after insertion of 150 ASP particles are depicted similarly in red including a depiction of the 150 activated ASP particles (red spheres); (c) A depiction of the 150 activated ASP particles coloured according to the nearest heavy atom neighbour of the protein (CPK coloured spheres).

