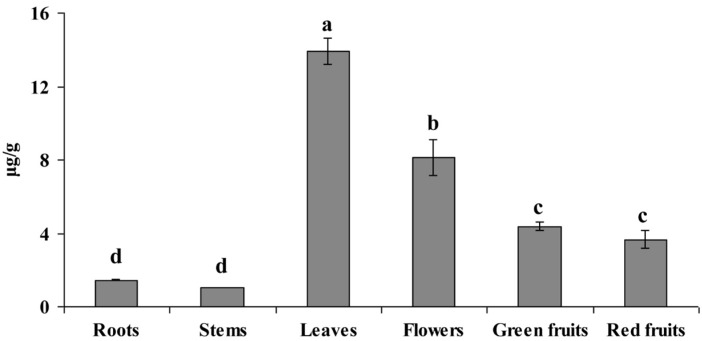
Figure 5.
Riboflavin content in different organs of L. chinense.
The height of each bar and the error bars show the mean and standard errors, respectively, from three independent measurements. The letters a, b, c, and d indicate significant differences at the 5% level by Duncan’s multiple range test.

