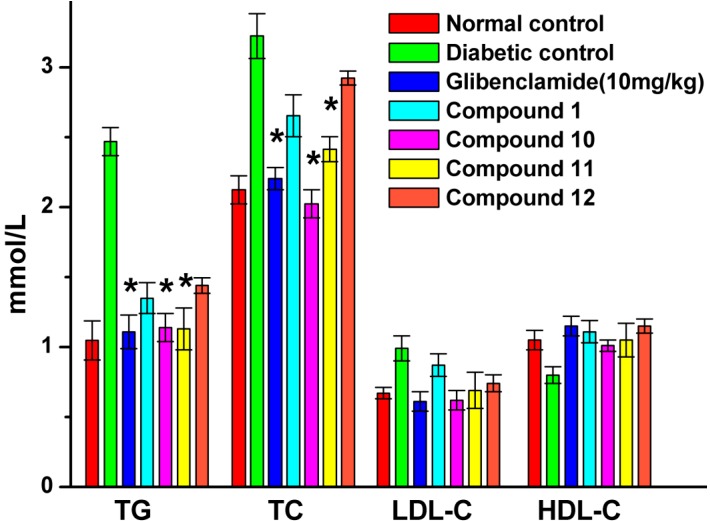
Figure 6.
Effects of compounds 1, 10, 11 and 12 on serum lipid profiles of STZ-induced diabetic rats in comparison with normal and diabetic control rats after 4 weeks of treatment. At the end of the treatment period, rats were fasted for 12 h and blood was drawn to collect the serum. The data reported represent the means (n = 6) ± SD. * Significant difference compared to diabetic control (p < 0.05).

