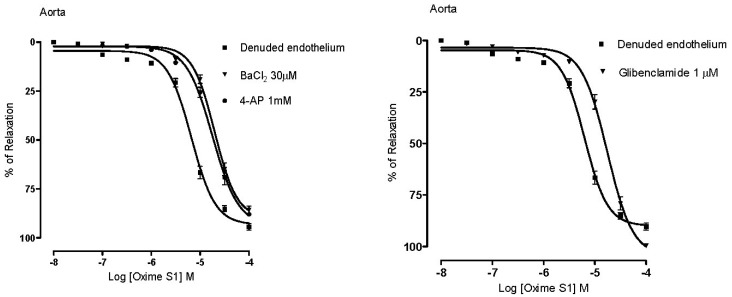
Figure 7.
Concentration-response curves showing the relaxant effect induced by Oxime S1 (10−8 to 10−4 M) in aorta in the absence or presence of: BaCl2 (▼); 4-AP (●); or Glibenclamide (▼). Values are expressed as mean ± s.e.m. Each data point represents the mean and the s.e.m. from 7 different experiments.

