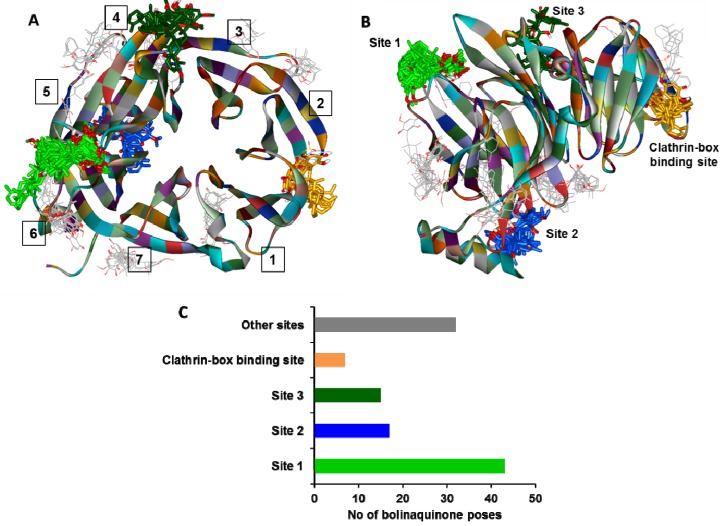
Figure 2.
(A) Ribbon representation of a top view of the CTD (2XZG). The positioning of each of the seven β-stranded blades is indicated by the numbers 1-7. The predicted binding clusters for the docked 1 poses are rendered in stick representation and are color coded (non-carbon atoms) with  (clathrin-box binding site),
  (site 1),
  (site 2) and
  (site 3). (B) Same representation as in A rotated 90° inward, indicating potential 1 binding sites. (C) Bar graph representation of the number of 1 poses in each binding site cluster shown in A and B. The bar colors correspond to the binding sites and 1-clusters identified in A and B.

