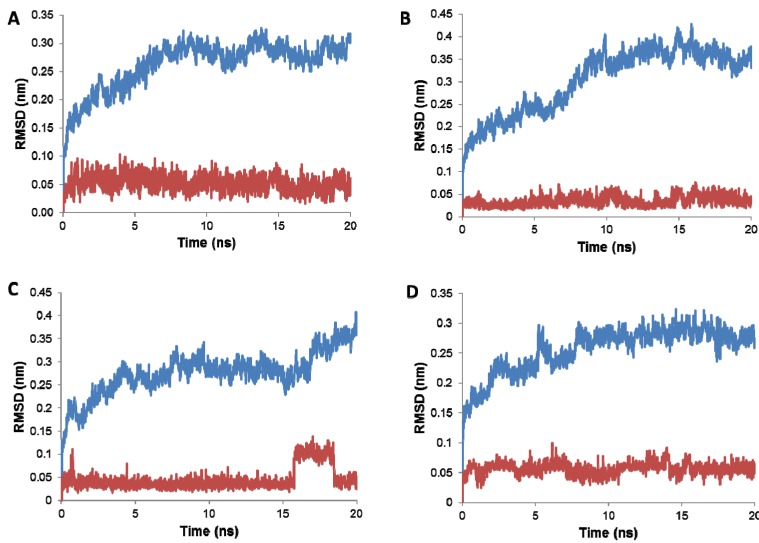
Figure 3.
Molecular dynamics trajectory plots correlating RMSD deviation from the initial 1-CTD protein Cα atoms (blue) and 1 heavy atoms (red) coordinates over a simulation time of 20 ns. (A) Trajectory plot output for binding site 1; (B) Trajectory plot output for binding site 2; (C) Trajectory plot output for binding site 3; and (D) Trajectory plot output for the clathrin-box binding site. Stable complexes are shown in A, B and D while C shows distortion of the complex structure just after 15 ns.

