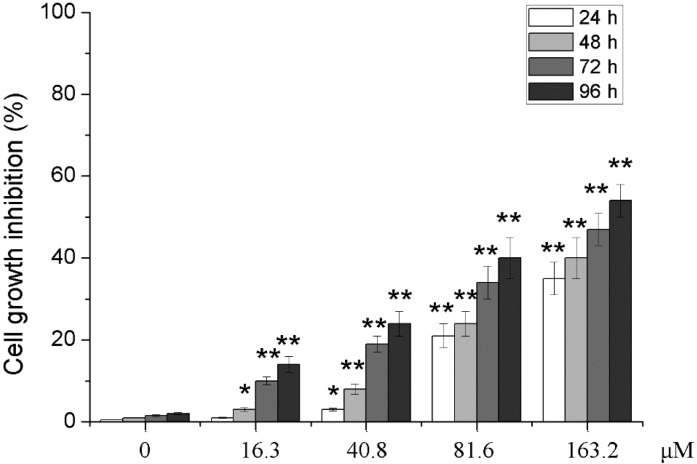
Figure 2.
Effects of PD on cell growth inhibition of U251. U251 cells were treated with 0, 16.3, 40.8, 81.6 and 163.2 μM of PD for 24, 48, 72 and 96 h. Cell growth inhibition was measured by using MTT assay. Each value is presented as mean ± SD (n = 3). * p < 0.05 compared with 0 μM PD; ** p < 0.01 compared with 0 μM PD.

