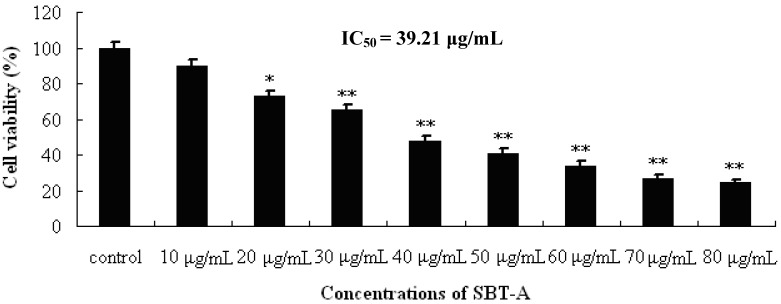
Figure 2.
Proliferation inhibiting effects of SBT-A on A549 cells. A549 cell lines were treated with low to high concentrations of SBT-A (10, 20, 30, 40, 50, 60, 70 and 80 μg/mL) for 48 h, and cells proliferation was determined by MTT assay. The IC50 value was 39.21 μg/mL. The data are represented as mean ± S.D (n = 4). * p < 0.05 and ** p < 0.01 vs. control.

