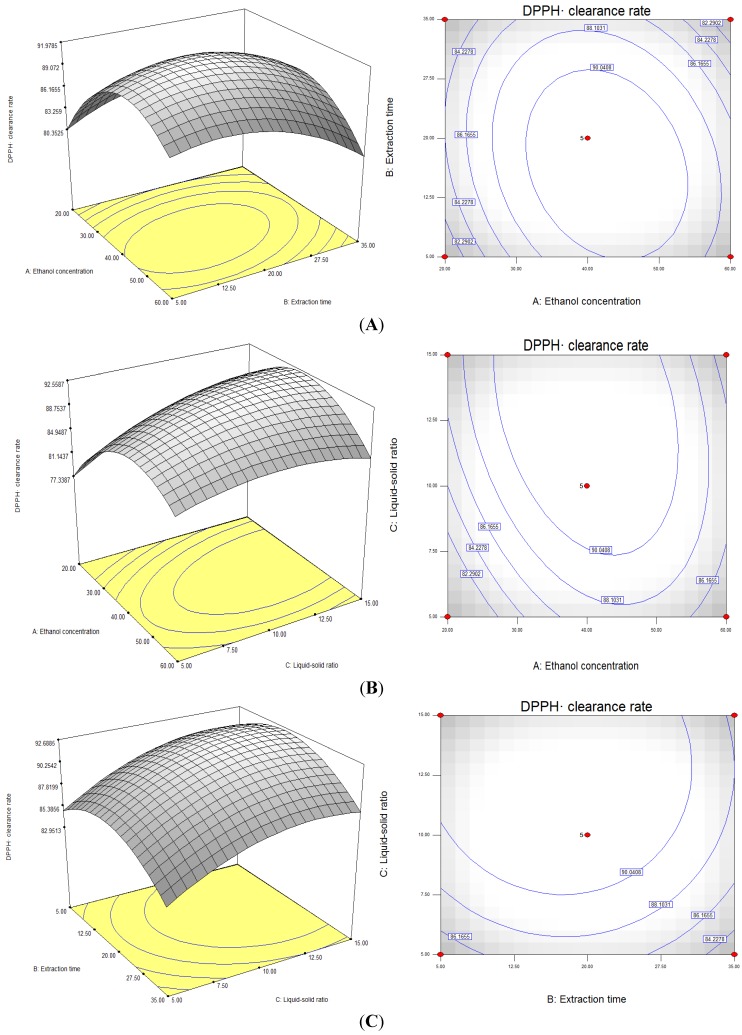
Figure 3.
Response surfaces and contour plots showing: (A) the effects of ethanol concentration and extraction time on DPPH· scavenging rate Y = (A, B); (B) the effects of ethanol concentration and liquid-solid ratio on DPPH· scavenging rate Y = (A, C); (C) the effects of extraction time and liquid-solid ratio on DPPH· scavenging rate Y = (B, C).

