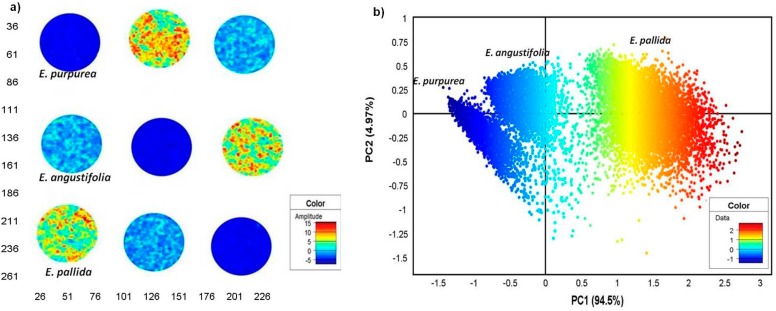
Figure 5.
PCA score image (t1) of Echinacea root powders showing distinction of the three species based on colour amplitudes (a). The corresponding score plot (PC1 vs. PC2) shows distinct pixel clusters coloured according to score values that correspond to the images (b). (EAR—E. angustifolia root, EPR—E. purpurea root, EPaR—E. pallida root).

