Figure 3.
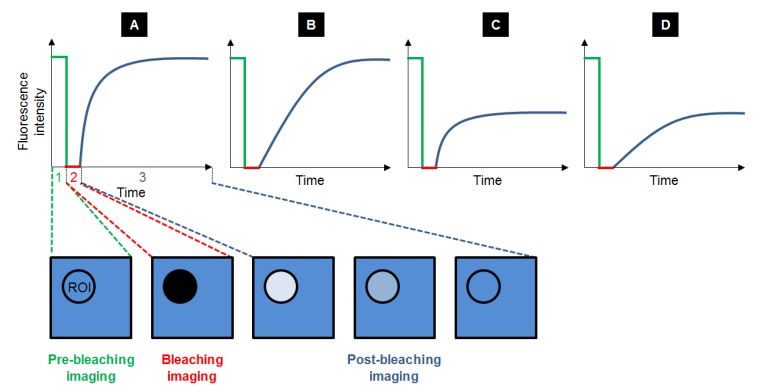
Typical recovery curves obtained after FRAP experiments: the fluorescence intensity is measured before (step 1, in green), during (step 2, in red) and after photobleaching (step 3, in blue), while equilibrium is taking place. Several cases can be observed depending on the velocity and the amplitude of the recovery. Recovery can be fast with a maximal recovery (A), or slow with a maximal recovery (B). It can also be fast with a limited recovery (C) and even slow with a limited recovery (D).

