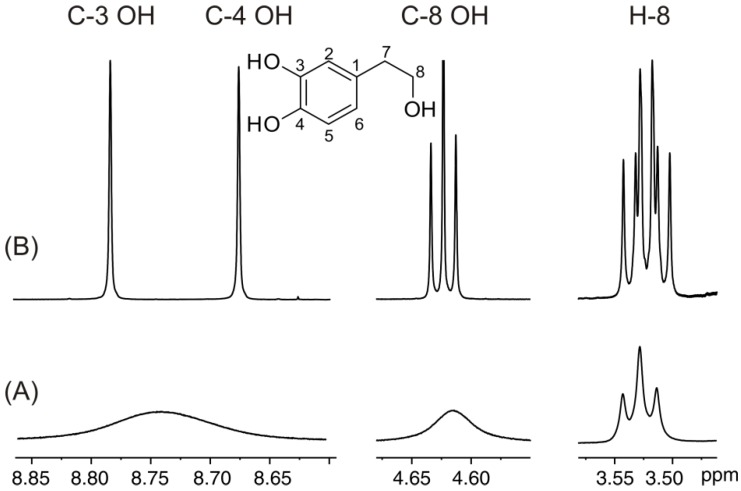
Figure 6.
500 MHz 1D 1H-NMR spectra of hydroxytyrosol (C = 19.6 × 10⁻³ M, T = 288 K, number of scans = 16), in (A) DMSO-d6; (B) with a molar ratio of [picric acid]/[hydroxytyrosol] of 1.3 × 10⁻³. Reproduced with permission from [16]. Copyright 2011, by the American Chemical Society.

