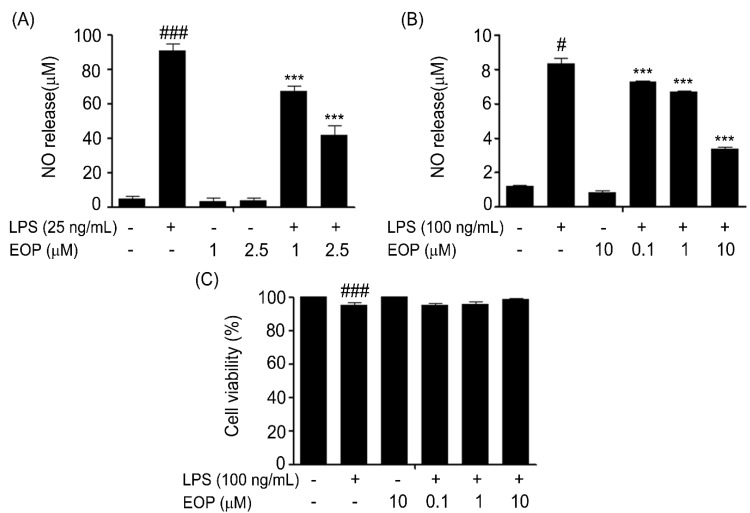
Figure 2.
The effect of EOP on cell viability and production of nitric oxide (NO) in lipopolysaccharide (LPS)-stimulated mouse BV-2 microglial cells. (A) Rat primary microglia and (B) BV-2 cells were pre-treated with different concentrations of EOP (1 and 2.5 μM) and (0.1, 1 and 10 μM) for 60 min before incubating with LPS (25/100 ng/mL) for 24 h. Nitrite content in the culture media was measured using the Griess reaction, and the results were expressed as a percentage of released NO from LPS-stimulated BV-2 cells. (C) Cells were treated with various doses of EOP (0.1, 1 and 10 μM) for 60 min before incubating with LPS (100 ng/mL) for 24 h. The cytotoxicity of EOP was assessed by the MTT assay, and the results are expressed as a percentage of surviving cells over control cells. Data are expressed as a percentage of the control. Data are the mean ± standard error (SEM) of three independent experiments. ### p < 0.001 compared with the control group and *** p < 0.001 compared with the LPS-treated group. Significance was determined by one-way analysis of variance followed by Bonferroni’s multiple comparison test.

