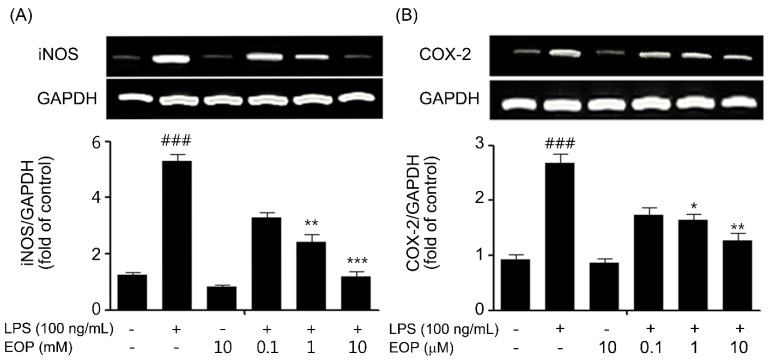
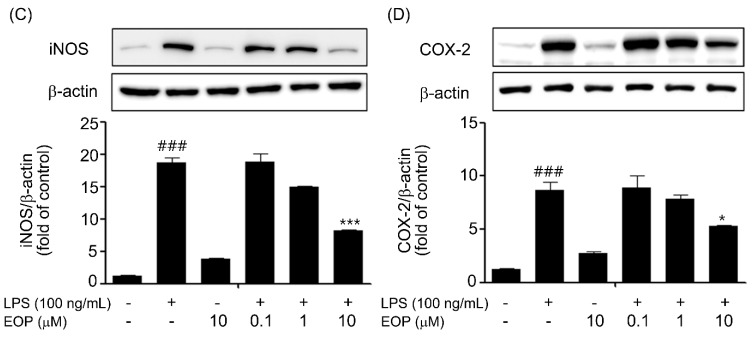
Figure 3.
EOP inhibits lipopolysaccharide (LPS)-stimulated release of inducible nitric oxide synthase (iNOS) and cyclooxygenase-2 (COX-2) in BV-2 microglial cells. BV-2 microglial cells were pre-treated with the indicated concentrations of EOP for 60 min before incubating with LPS (100 ng/mL) for 6 h. Quantified data are shown in the lower panel. (A) iNOS and (B) COX-2 mRNA levels were normalized to those of GAPDH and expressed as the relative change in comparison to the LPS treatment. BV-2 cells were pretreated with EOP (0.1, 1 and 10 μM) for 60 min and then stimulated with LPS (100 ng/mL) for 18 h. Quantification of (C) iNOS and (D) COX-2 was performed by normalization with β-actin and expressed as the relative change in comparison to the LPS treatment. Data are the mean ± standard error (SEM) of three independent experiments. ### p < 0.001 compared with the control group; *** p < 0.001, ** p < 0.01 and * p < 0.05 compared with the LPS-treatedgroup. Significance was determined by one-way analysis of variance followed by Bonferroni’s multiple comparison test.


