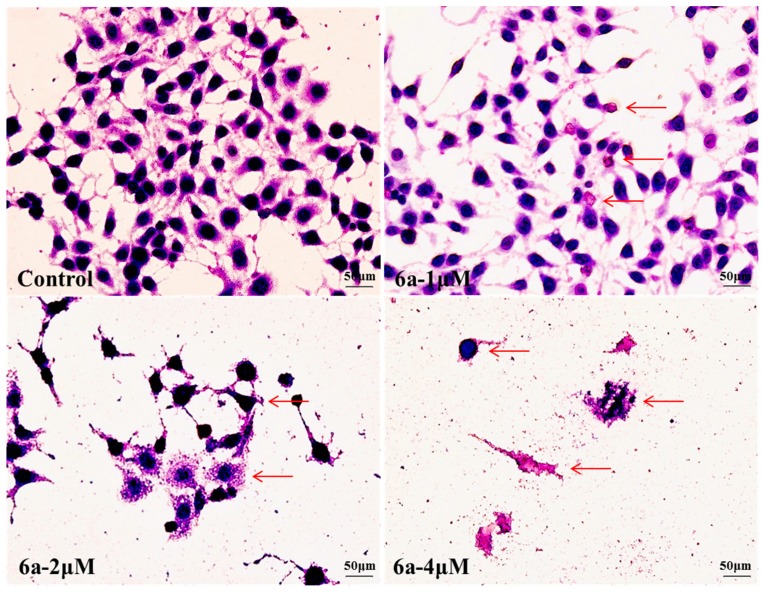
Figure 2.
Morphological changes of HepG2 cells after treatment with 0, 1, 2 and 4 μM of 6a was observed under inverted phase-contrast microscope at a magnification of 400×. Cells showed changes in cell morphology, included loss of intercellular contacts, lysis of nuclei, increased cell debris and membrane damage (arrows) with increasing doses of 6a when compared to the control cells. Data were derived from three independent experiments.

