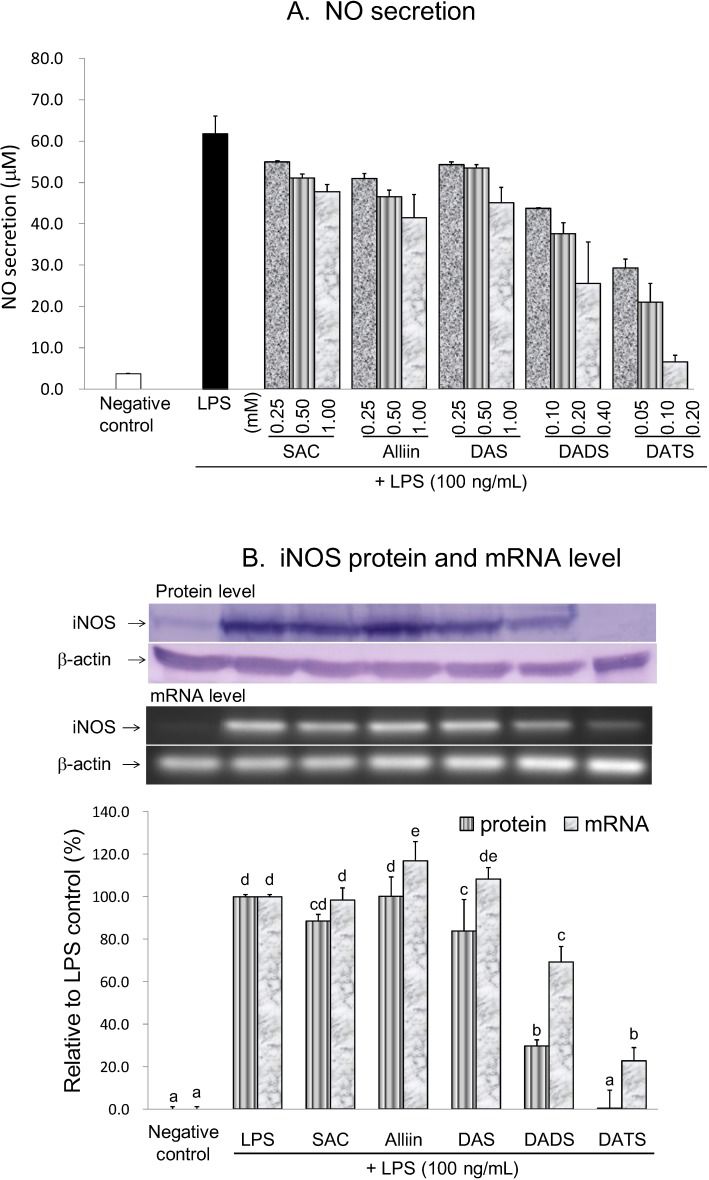
Figure 4.
Effects of the selected OSCs on the NO production (A); iNOS protein and mRNA levels (B) in LPS-activated BV2 microglia. In part B, the treatment concentration is 1000 µM for SAC, alliin and DAS; 400 µM for DADS; and 200 µM for DATS. The values are expressed as means ± SD of triplicate tests. Means not sharing a common letter were significantly different (p < 0.05) when analyzed by ANOVA and Duncan’s multiple range test.

