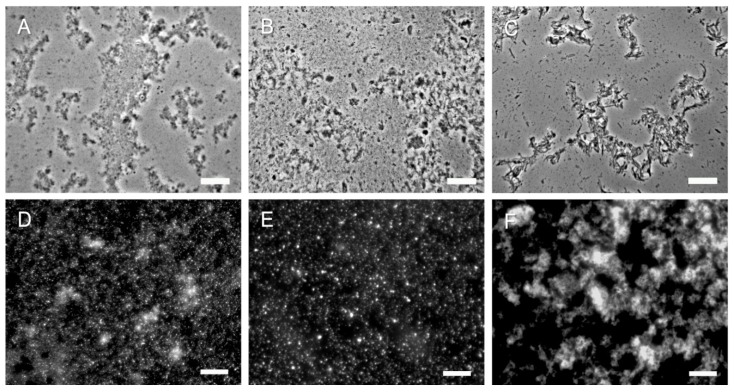
Figure 5.
Representative microscopy images of SSCs and 2 k chitin from hyphae of three different fungi. (A–C) 2 k fractions from C. albicans, A. fumigatus and M. circinelloides, respectively (phase contrast); (D–F) SSCs from the corresponding fungi were stained with CFW and then viewed by fluorescence microscopy. Bars, 10 µm.

