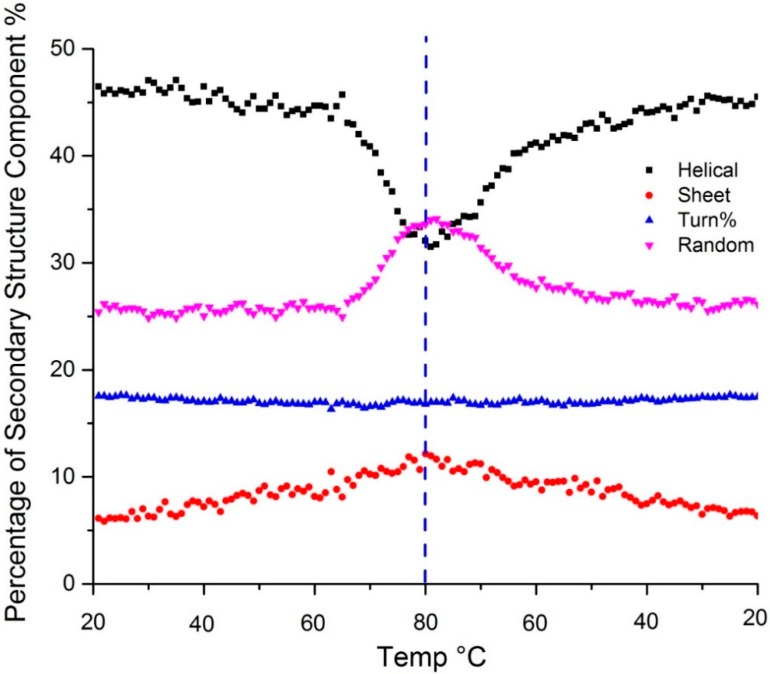
Figure 3.
Secondary structure predicted using a PLS model shows change in α-helix (black), β-sheet (red), β-turn (blue) and random coil (purple) content as a function of temperature. The dotted vertical line indicates the point of the highest sample temperature, the point at which the sample ramp changed from heating to cooling.

