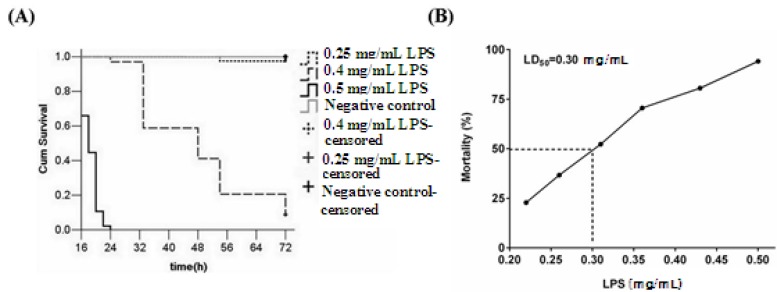
Figure 7.
Average cumulative mortality (percent) of zebrafish larvae at different LPS concentrations (A) and the relationship between LPS concentration and mean larval mortality (B). One hundred and forty larvae were randomly divided into four groups (n = 35). The yolks of larvae were injected at 3-dpf with the indicated doses of LPS, and larvae were monitored for 48 h. Negative controls were larvae injected with PBS. Each curve represents data pooled from three independent experiments.

