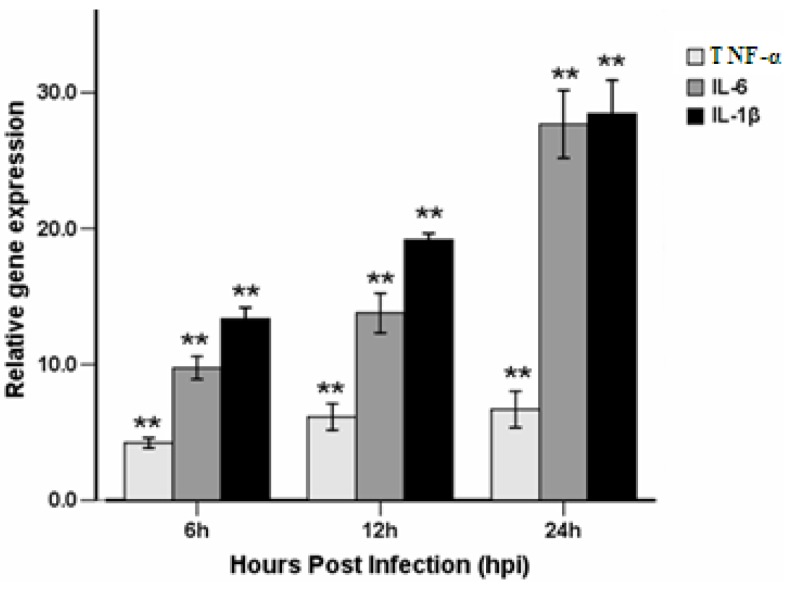
Figure 8.
Effect of injection time for the genes expressions of inflammation cytokines by RT-PCR. Expressions of TNF-α, IL-6, and IL-1β gene in 0.5 mg/mL LPS-infected larvae compared with controls determined by quantitative real-time PCR. Larvae were injected with 0.5 mg/mL LPS at 3 dpf. Total RNA was extracted from larvae at 6, 12, and 24 hpi. Each bar represents the mean of three replicates. Error bars represent standard deviation.

